Fig. 1
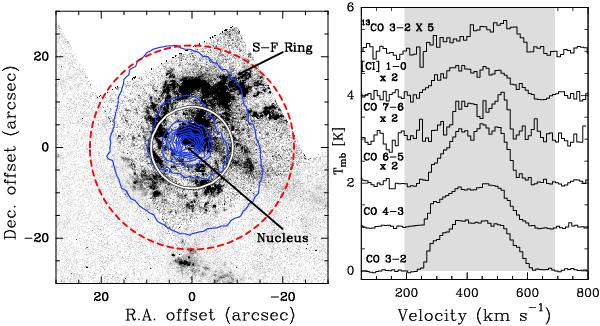
Left panel: Herschel 70 μm contours overlaid on an Hα image of the HST (Wilson et al. 2000). The contour levels are 500, 1000, 2000, 3000, and 4000 MJy/sr. The concentric circles show the beam sizes of 12COJ = 3 → 2 for APEX (18′′, white thick line) and 12COJ = 1 → 0 for SEST (45′′, red dashed line). Right panel: CO spectra observed in the central position. 12COJ = 6 → 5, 7 → 6, and Ci are multiplied by a factor of 2, and 13COJ = 3 → 2 is multiplied by a factor of 5. The (shaded) line emission ranges from ~200 to ~700kms-1.

Current usage metrics show cumulative count of Article Views (full-text article views including HTML views, PDF and ePub downloads, according to the available data) and Abstracts Views on Vision4Press platform.
Data correspond to usage on the plateform after 2015. The current usage metrics is available 48-96 hours after online publication and is updated daily on week days.
Initial download of the metrics may take a while.