Fig. 1
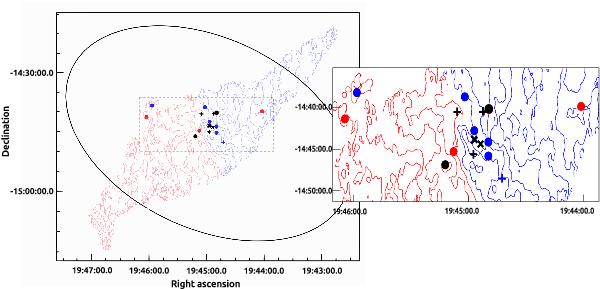
Radial velocity map of H i from de Block & Walter (2006). The blue contours run from −55 km s-1 in the inner part to −110 km s-1 in the outer NW zone, in steps of 5 km s-1. The red contours run from −50 km s-1 in the central zone to +10 km s-1 in the outer SE zone. The ellipsoid represents the stellar spheroid analyzed by Battinelli et al. (2006) and Demers et al. (2006). Position of the PNe (filled dots), H ii regions (crosses) and A-type supergiants (x marks) are those presented in Table 2. Blue symbols indicate a negative difference between observed objects and H i velocities. Red symbols indicate a positive difference. In black we plot objects with a velocity difference smaller than 12 km s-1, relative to H i disk. A zoom of the central zone is shown.
Current usage metrics show cumulative count of Article Views (full-text article views including HTML views, PDF and ePub downloads, according to the available data) and Abstracts Views on Vision4Press platform.
Data correspond to usage on the plateform after 2015. The current usage metrics is available 48-96 hours after online publication and is updated daily on week days.
Initial download of the metrics may take a while.