Fig. 2
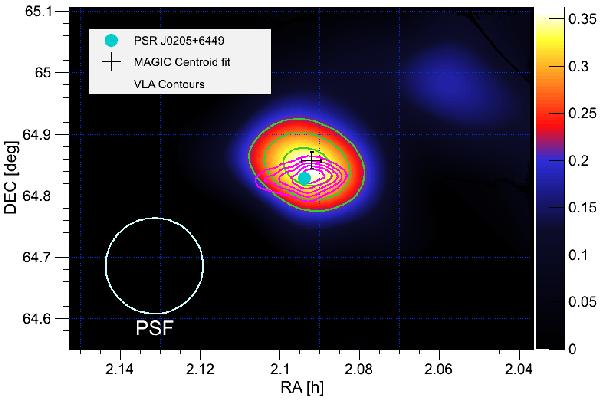
Relative flux (excess/background) map for MAGIC observations. The cyan circle indicates the position of PSR J0205+6449 and the black cross shows the fitted centroid of the MAGIC image with its statistical uncertainty. In green we plot the contour levels for the TS starting at 4 and increasing in steps of 1. The magenta contours represent the VLA flux at 1.4 GHz (Condon et al. 1998), starting at 0.25 Jy and increasing in steps of 0.25 Jy.
Current usage metrics show cumulative count of Article Views (full-text article views including HTML views, PDF and ePub downloads, according to the available data) and Abstracts Views on Vision4Press platform.
Data correspond to usage on the plateform after 2015. The current usage metrics is available 48-96 hours after online publication and is updated daily on week days.
Initial download of the metrics may take a while.