Fig. 1
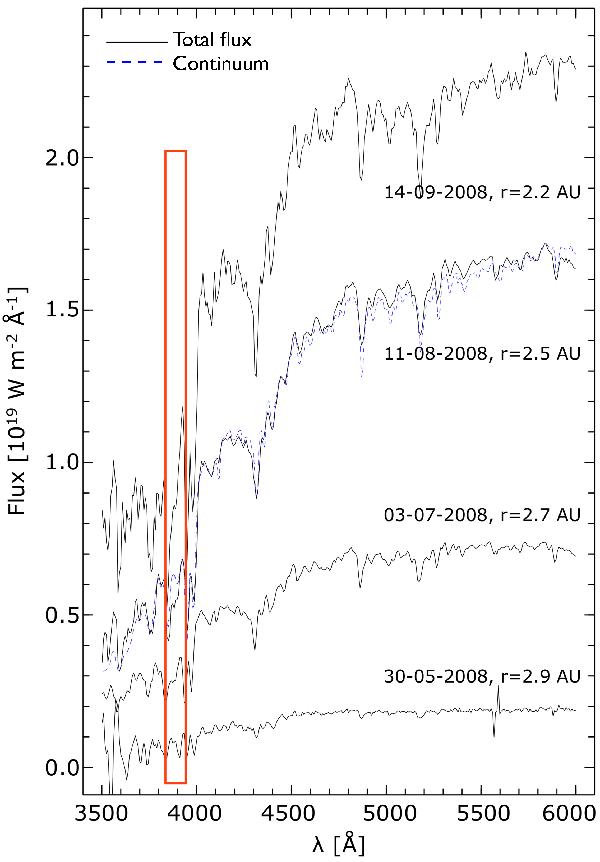
Pre-perihelion co-added spectra of comet 67P, presented as flux vs. wavelength. The total flux increases from May 2008 (bottom) to September 2008 (top). The continuum is shown as a dotted line for only one spectrum. The superimposed rectangle highlights the wavelength range where we would expect to detect a CN emission feature: none is detected here.
Current usage metrics show cumulative count of Article Views (full-text article views including HTML views, PDF and ePub downloads, according to the available data) and Abstracts Views on Vision4Press platform.
Data correspond to usage on the plateform after 2015. The current usage metrics is available 48-96 hours after online publication and is updated daily on week days.
Initial download of the metrics may take a while.