Fig. 2
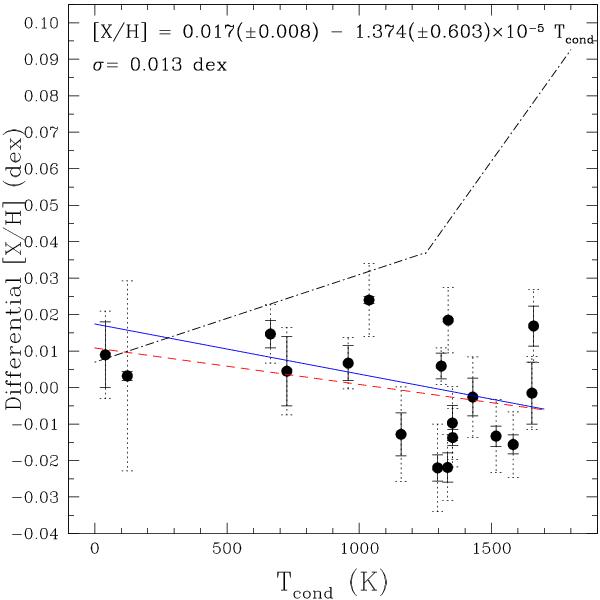
Abundance pattern of HIP 114328 (circles) vs. condensation temperature. The solid error bars are based only on the observational uncertainties, and the dotted error bars are the total errors (average ~0.011 dex). The solid line is a fit taking into account the total error bars and the dashed line is a fit without considering error bars. The element-to-element scatter from the fit is only σ = 0.013 dex, in good agreement with the mean error bar. The dot-dashed line is the mean abundance pattern of 11 solar twins from Meléndez et al. (2009), shifted vertically to match the volatile element carbon.
Current usage metrics show cumulative count of Article Views (full-text article views including HTML views, PDF and ePub downloads, according to the available data) and Abstracts Views on Vision4Press platform.
Data correspond to usage on the plateform after 2015. The current usage metrics is available 48-96 hours after online publication and is updated daily on week days.
Initial download of the metrics may take a while.