Free Access
Fig. 3
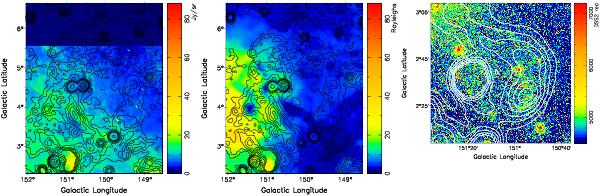
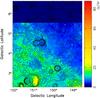
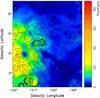
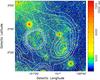
60 μm infrared (left panel) and Hα emission (middle panel) in the area of G150.3+4.5. The contours are the same for the λ6 cm image shown in the upper panel of Fig. 1. Right panel: optical emission from the DSS2 red image in the field of G151.2+2.6. λ6 cm total intensity contours run at 6.0 mK Tb in steps of 6.0 mK Tb.
This figure is made of several images, please see below:
Current usage metrics show cumulative count of Article Views (full-text article views including HTML views, PDF and ePub downloads, according to the available data) and Abstracts Views on Vision4Press platform.
Data correspond to usage on the plateform after 2015. The current usage metrics is available 48-96 hours after online publication and is updated daily on week days.
Initial download of the metrics may take a while.