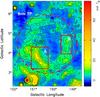
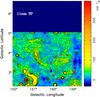
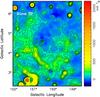
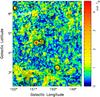
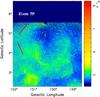
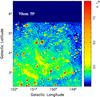
Fig. 1
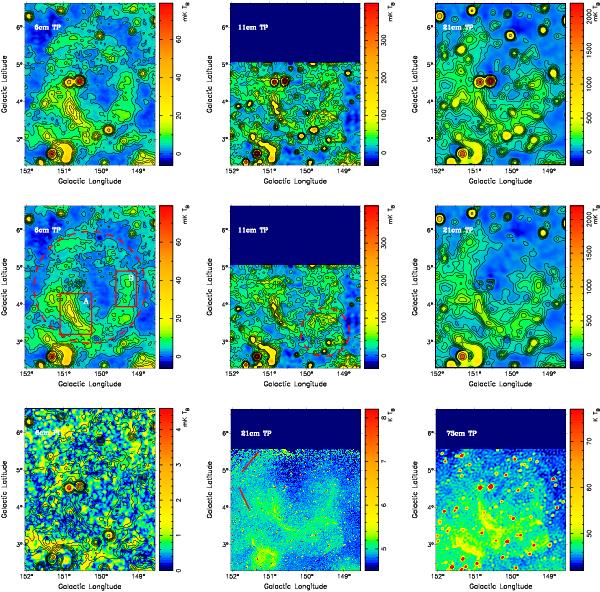
Radio continuum images of the new SNR G150.3+4.5. Top panels: total intensity of G150.3+4.5 obtained from Urumqi λ6 cm (left), Effelsberg λ11 cm (central), and Effelsberg λ21 cm (right) observations. The contours run at 3.0 + (n − 1) × 3.0 mK (n = 1,2,...6) and 21.0 + (n − 7) × 21.0 mK (n = 7,8..) for the λ6 cm image, at 20.0 + (n − 1) × 13.4 mK (n = 1,2,...6) and 85.0 + (n − 7) × 212.0 mK (n = 7,8..) for the λ11 cm image, at 60.0 + (n − 1) × 40.0 mK (n = 1,2,...6) and 320.0 + (n − 7) × 600.0 mK (n = 7,8..) for the λ21 cm image. Middle panels: the same images as upper panels, but point-like sources are removed within the central 3° field as indicated by the circle in the left panel. Bottom panels: images for the λ6 cm polarization intensity (left), the CGPS λ21 cm total intensity (central) and λ73.5 cm total intensity (right). The contours on the λ6 cm polarization image is the same as for the λ6 cm total intensity image shown in the upper panels. The angular resolutions for observations of the Urumqi λ6 cm, Effelsberg λ21 cm, CGPS λ21 cm, and λ73.5 cm images are 9 5, 94, 60′′ × 49′′, and
  , respectively. The Effelsberg λ11 cm image was convolved to the resolution of 6′ to increase the signal-to-noise ratio. The rectangles A and B as indicated in the middle left panel are the areas for TT plots in Fig. 2. The dashed circle in the middle central panel indicates the newly discovered SNR G149.5+3.2 by Gerbrandt et al. (2014), which overlaps with the lower part of the western shell of G150.3+4.5. The two straight lines shown in the CGPS λ21 cm total intensity image indicate the emission, which does not seem to be connected to the eastern shell of G150.3+4.5.
Current usage metrics show cumulative count of Article Views (full-text article views including HTML views, PDF and ePub downloads, according to the available data) and Abstracts Views on Vision4Press platform.
Data correspond to usage on the plateform after 2015. The current usage metrics is available 48-96 hours after online publication and is updated daily on week days.
Initial download of the metrics may take a while.