Fig. 9
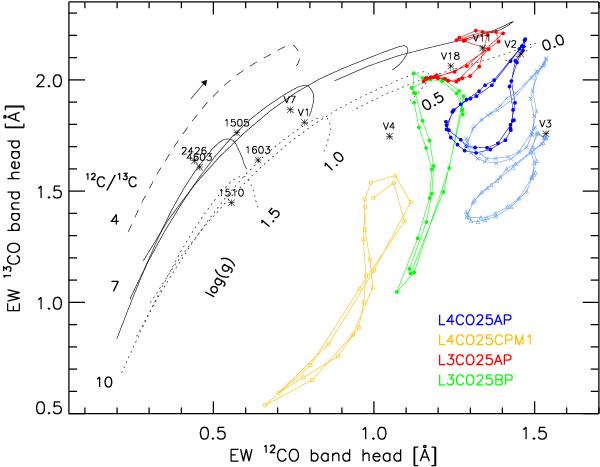
Equivalent widths in [Å] of the 13CO band head versus the 12CO band head. 47 Tuc stars are marked with asterisks. Black lines indicate effective temperature sequences of hydrostatic MARCS models for various constant log g values and three different values for the carbon isotopic ratio 12C/13C (as labelled). The temperature is decreasing in the direction of the small arrow. Coloured lines again show the location of the dynamical models with a carbon isotopic ratio of 7 assumed. In the case of L4CO25AP, we show also the results for differing 12C/13C ratios of 10 and 30 (light blue).
Current usage metrics show cumulative count of Article Views (full-text article views including HTML views, PDF and ePub downloads, according to the available data) and Abstracts Views on Vision4Press platform.
Data correspond to usage on the plateform after 2015. The current usage metrics is available 48-96 hours after online publication and is updated daily on week days.
Initial download of the metrics may take a while.