Fig. 8
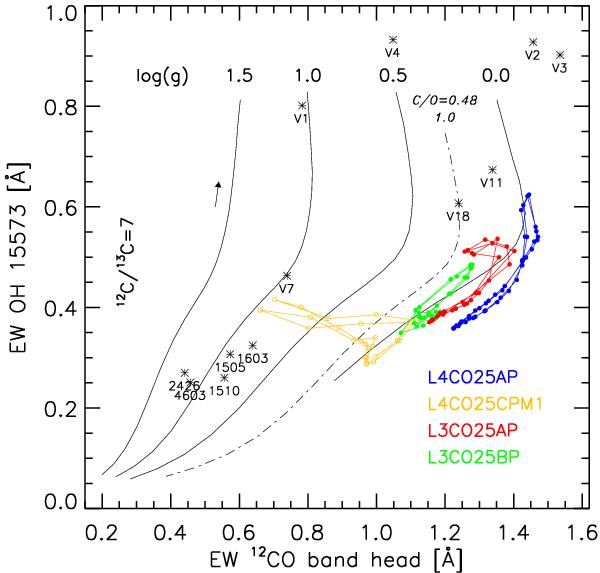
Equivalent widths in [Å] of the OH line at 15573 Å versus the strength of the 12CO band head. The 47 Tuc stars (Table 1) are marked with asterisks. Sequences of hydrostatic models (with varying Teff but constant log g) are shown as black lines, the corresponding log g values are labelled at the top of these lines. The small arrow indicates the trend of decreasing temperature. Coloured lines mark the location of selected dynamical models during the light cycles. For all models, the carbon isotopic ratio 12C/13C was set to 7. The C/O ratio is 0.25 if not stated otherwise.
Current usage metrics show cumulative count of Article Views (full-text article views including HTML views, PDF and ePub downloads, according to the available data) and Abstracts Views on Vision4Press platform.
Data correspond to usage on the plateform after 2015. The current usage metrics is available 48-96 hours after online publication and is updated daily on week days.
Initial download of the metrics may take a while.