Fig. 7
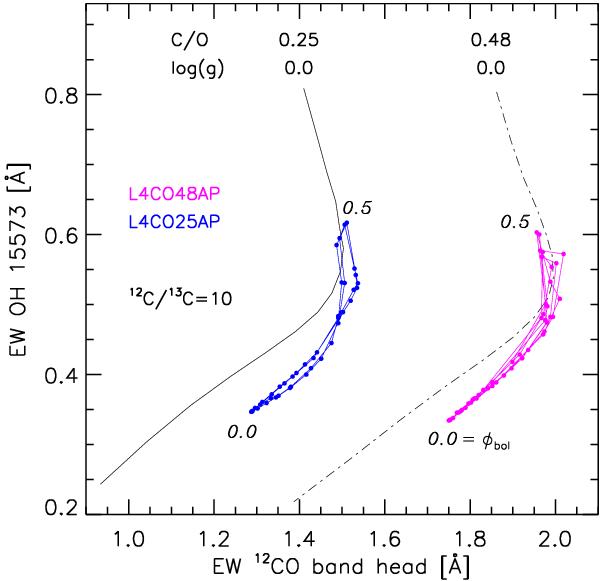
Equivalent widths in [Å] of the OH line at 15 573 Å versus the strength of the 12CO band head. Black lines mark temperature sequences for log g = 0.0 and two different C/O ratios. The two coloured lines show the behaviour of the dynamic models L4C048AP and L4C025AP. Maximum and minimum phases are indicated (Φbol = 0.0 and 0.5, respectively). For all calculations a 12C/13C ratio of 10 was assumed.
Current usage metrics show cumulative count of Article Views (full-text article views including HTML views, PDF and ePub downloads, according to the available data) and Abstracts Views on Vision4Press platform.
Data correspond to usage on the plateform after 2015. The current usage metrics is available 48-96 hours after online publication and is updated daily on week days.
Initial download of the metrics may take a while.