Fig. 4
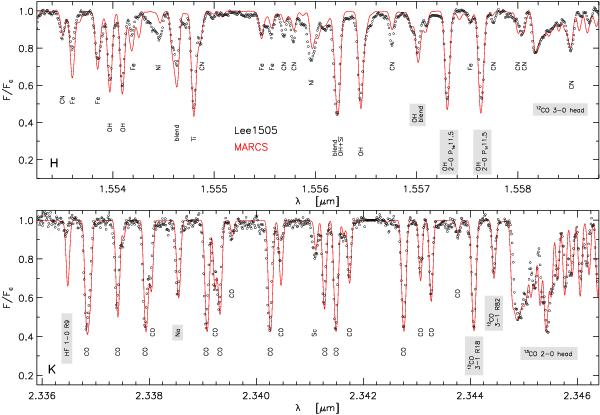
Comparison of the observed spectrum of the non-variable 47 Tuc star Lee 1505 with the best-fitting hydrostatic MARCS model (red lines). The upper panel shows the H band spectrum, the lower panel the K band spectrum. Several prominent lines are identified. Grey-shaded identifications mark those lines we used in our analysis (Table 2).
Current usage metrics show cumulative count of Article Views (full-text article views including HTML views, PDF and ePub downloads, according to the available data) and Abstracts Views on Vision4Press platform.
Data correspond to usage on the plateform after 2015. The current usage metrics is available 48-96 hours after online publication and is updated daily on week days.
Initial download of the metrics may take a while.