Free Access
Fig. 3
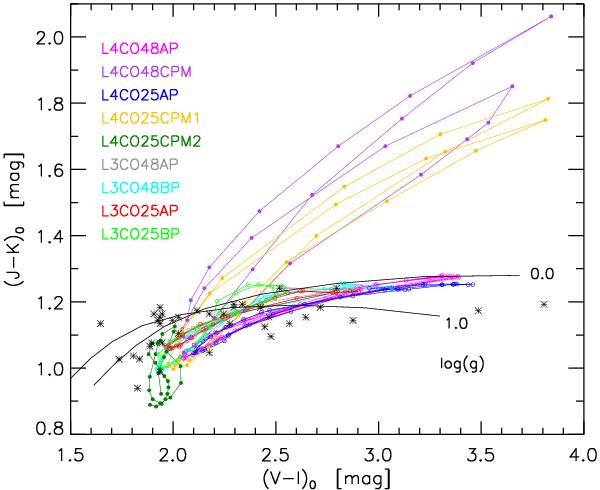
Colour–colour diagram for the 47 Tuc variables from Lebzelter & Wood (2005), marked with asterisks. Overplotted are temperature sequences of hydrostatic MARCS models for two different values of log g (black solid lines), and the phase-dependent photometry for the dynamical model atmospheres.
Current usage metrics show cumulative count of Article Views (full-text article views including HTML views, PDF and ePub downloads, according to the available data) and Abstracts Views on Vision4Press platform.
Data correspond to usage on the plateform after 2015. The current usage metrics is available 48-96 hours after online publication and is updated daily on week days.
Initial download of the metrics may take a while.