Fig. 12
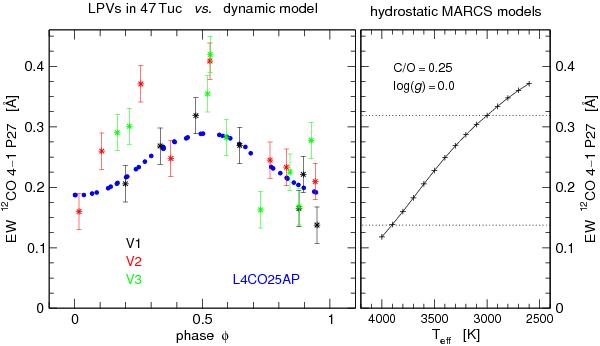
Left: variation in the equivalent widths in [Å] of the 12CO 4-1 P27 line over the light cycle for the three 47 Tuc LPVs with the largest photometric amplitudes (V1, V2, V3, colour coded). Also shown is the corresponding variation with pulsation phase as derived for the dynamical model L4C025AP. Right: line-strength variation of the same line for one Teff-sequence of hydrostatic models with log g = 0.0. The dotted lines mark the total range of equivalent widths measured for V1.
Current usage metrics show cumulative count of Article Views (full-text article views including HTML views, PDF and ePub downloads, according to the available data) and Abstracts Views on Vision4Press platform.
Data correspond to usage on the plateform after 2015. The current usage metrics is available 48-96 hours after online publication and is updated daily on week days.
Initial download of the metrics may take a while.