Free Access
Fig. 11
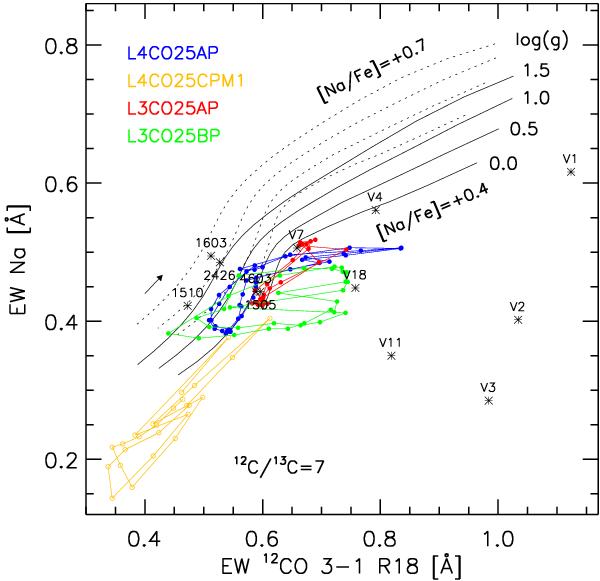
Equivalent widths in [Å] of the sodium line at 23383 Å versus the EW of the 12CO 3–1 R18 line. Same symbols and line styles as in Fig. 8. Hydrostatic models are plotted for [Na/Fe] = + 0.4 and +0.7, dynamical models for [Na/Fe] = + 0.4, respectively.
Current usage metrics show cumulative count of Article Views (full-text article views including HTML views, PDF and ePub downloads, according to the available data) and Abstracts Views on Vision4Press platform.
Data correspond to usage on the plateform after 2015. The current usage metrics is available 48-96 hours after online publication and is updated daily on week days.
Initial download of the metrics may take a while.