Fig. 4
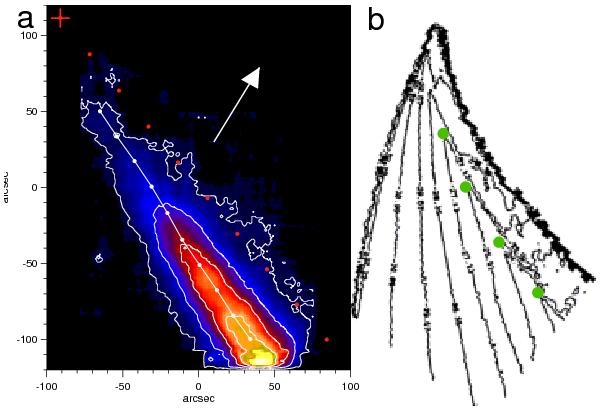
a) Zoom of the last image in Fig. 2. The bi-sector of the tail is indicated by a white line. Predicted positions of the nucleus at mid-exposure for the last 10 min are shown as red dots (ending with a cross) and indicate the trajectory. The arrow points toward Sun center. The tail is offset from the trajectory and not parallel to it. b) A model dust tail can reproduce the observation. The line of green dots marking the tip points of the higher-level contours resembles the tail axis, if we assume a violent dust emission burst ≈8.5 h prior to perihelion transit followed by a sharp decrease of the dust production.
Current usage metrics show cumulative count of Article Views (full-text article views including HTML views, PDF and ePub downloads, according to the available data) and Abstracts Views on Vision4Press platform.
Data correspond to usage on the plateform after 2015. The current usage metrics is available 48-96 hours after online publication and is updated daily on week days.
Initial download of the metrics may take a while.