Free Access
Fig. 4
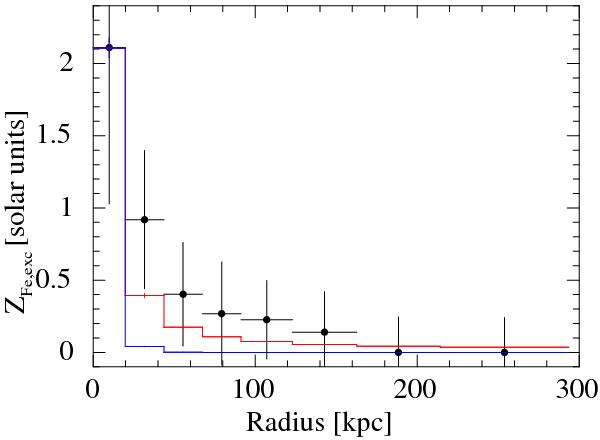
Comparison between the observed (black dots) and expected (lines) Fe abundance excess profiles for WARPJ1415 at z = 1.03. The red and blue lines are the expected profiles computed taking the errors in the observed BCG’s Ks profile shown in Fig. 1 into account.
Current usage metrics show cumulative count of Article Views (full-text article views including HTML views, PDF and ePub downloads, according to the available data) and Abstracts Views on Vision4Press platform.
Data correspond to usage on the plateform after 2015. The current usage metrics is available 48-96 hours after online publication and is updated daily on week days.
Initial download of the metrics may take a while.