Fig. 15
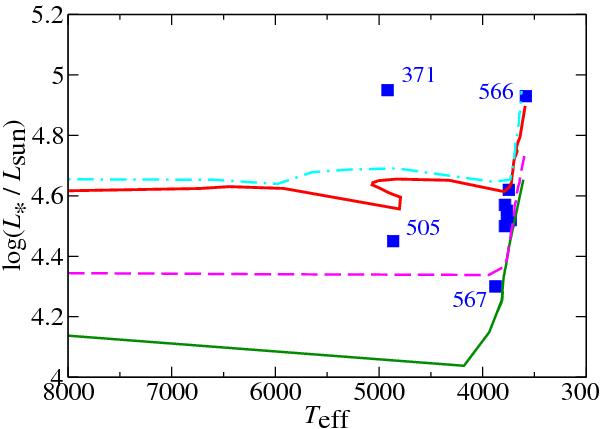
HR diagram showing the locations of 11 red and yellow supergiants in the cluster, with their positions derived from the spectral classification, assuming a distance to the cluster d = 10 kpc (DM = 15.0). We also plot isochrones from Ekström et al. (2012). The dotted lines are the log t = 7.20 (16 Ma; top, cyan), and log t = 7.30 (20 Ma; bottom, pink) isochrones with high initial rotation. The solid lines are the log t = 7.08 (12 Ma; top, red), and log t = 7.20 (16 Ma; bottom, green) isochrones without rotation. The size of the symbols represents the errors in log L∗ that are due to observational uncertainties and calibration problems. The errors in Teff, though difficult to quantify, should be smaller than the symbol size.
Current usage metrics show cumulative count of Article Views (full-text article views including HTML views, PDF and ePub downloads, according to the available data) and Abstracts Views on Vision4Press platform.
Data correspond to usage on the plateform after 2015. The current usage metrics is available 48-96 hours after online publication and is updated daily on week days.
Initial download of the metrics may take a while.