Fig. 11
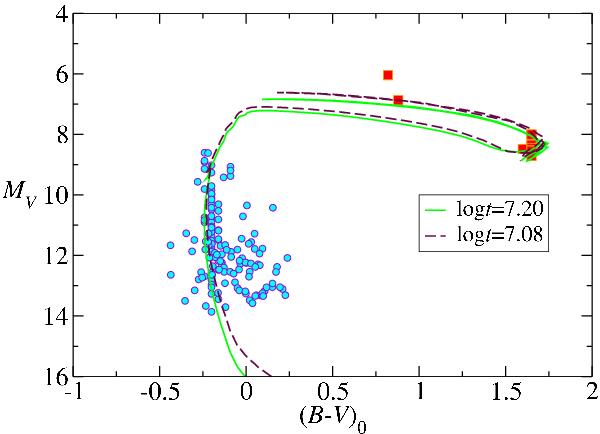
MV/ (B − V)0 diagram for selected likely members. Red squares represent red and yellow supergiants spectroscopically observed in the field. The solid line is the isochrone of Marigo et al. (2008) corresponding to log t = 7.20, unreddened and displaced to DM = 13.8. The dashed line is the isochrone of Marigo et al. (2008) corresponding to log t = 7.08, unreddened and displaced to DM = 14.5. The value used for R is the standard value of 3.1.
Current usage metrics show cumulative count of Article Views (full-text article views including HTML views, PDF and ePub downloads, according to the available data) and Abstracts Views on Vision4Press platform.
Data correspond to usage on the plateform after 2015. The current usage metrics is available 48-96 hours after online publication and is updated daily on week days.
Initial download of the metrics may take a while.