Free Access
Fig. B.1
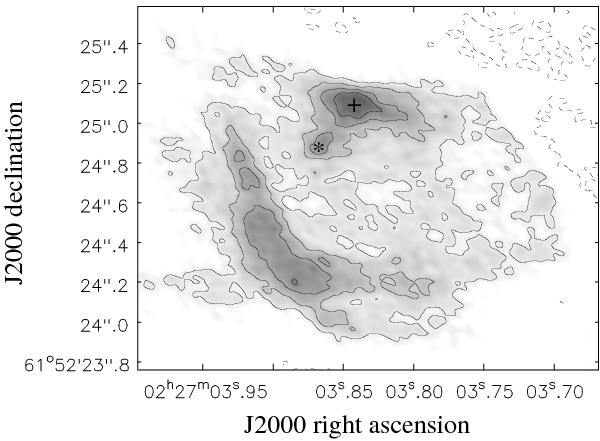
W3(OH) moment 0 image of the radio emission from the H54α recombination line. Gray scales and contour scales images are superposed to highlight those zones with less significant emission inside the UC H ii region. The contours are at −20, 20, 40, 60, and 80% the peak level of 301 mJy beam-1 km s-1.
Current usage metrics show cumulative count of Article Views (full-text article views including HTML views, PDF and ePub downloads, according to the available data) and Abstracts Views on Vision4Press platform.
Data correspond to usage on the plateform after 2015. The current usage metrics is available 48-96 hours after online publication and is updated daily on week days.
Initial download of the metrics may take a while.