Fig. 2
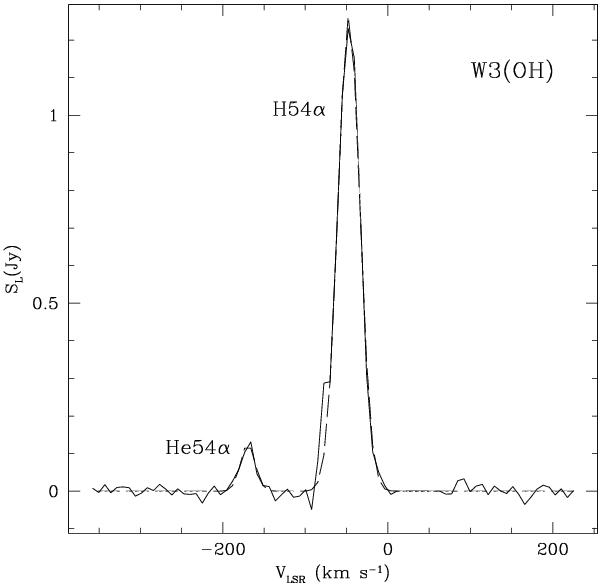
Radio recombination line spectrum for W3(OH), shown as flux density versus LSR radial velocity (solid line). The dashed line shows the least-squares fit to the spectrum. The continuum has been subtracted with a linear fit. We have no data for the 11.1 to 62.8 km s-1 radial velocity range, and we have interpolated the spectrum for this region with a straight line. The parameters of the recombination lines are given in Table 1.
Current usage metrics show cumulative count of Article Views (full-text article views including HTML views, PDF and ePub downloads, according to the available data) and Abstracts Views on Vision4Press platform.
Data correspond to usage on the plateform after 2015. The current usage metrics is available 48-96 hours after online publication and is updated daily on week days.
Initial download of the metrics may take a while.