Fig. 1
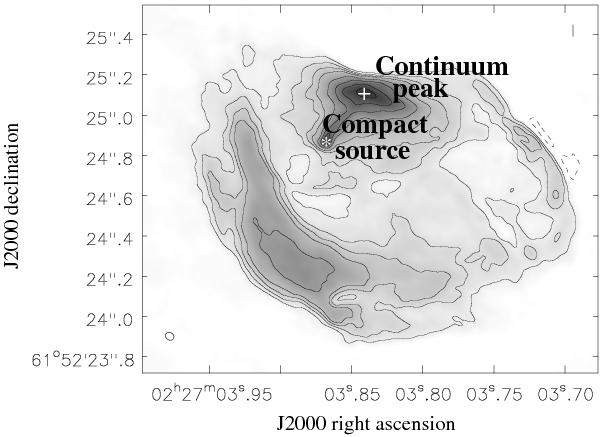
Image of the Stokes I parameter of the continuum radio emission from W3(OH) as detected in the Q band (41 GHz) observations. Gray scales and contour images are superposed to highlight those zones with less significant emission at the center of the UC H ii region. The contours are at −5, 5, 10, 15, 20, 30, 40, 50, and 60 times the 1σ noise level of 140 μJy beam-1. The half-power contour of the 41 GHz (0.′′ 044 × 0.′′ 035;PA = 55°) synthesized beam is shown in the bottom left corner.
Current usage metrics show cumulative count of Article Views (full-text article views including HTML views, PDF and ePub downloads, according to the available data) and Abstracts Views on Vision4Press platform.
Data correspond to usage on the plateform after 2015. The current usage metrics is available 48-96 hours after online publication and is updated daily on week days.
Initial download of the metrics may take a while.