Fig. 7
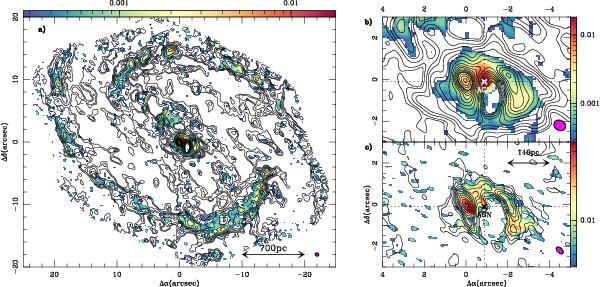
a) Overlay of the CO(3–2) intensity contours (levels as in Fig. 4a) on the dust continuum emission at 349 GHz (color scale in Jy beam-1 units as indicated). b) Same as a) but zooming in on the CND region. c) Overlay of the CO(6–5) intensity contours (levels as in Fig. 4c) on the dust continuum emission at 689 GHz (color scale in Jy beam-1 units as indicated). The filled ellipses at the bottom right corners represent the CO beam sizes.
Current usage metrics show cumulative count of Article Views (full-text article views including HTML views, PDF and ePub downloads, according to the available data) and Abstracts Views on Vision4Press platform.
Data correspond to usage on the plateform after 2015. The current usage metrics is available 48-96 hours after online publication and is updated daily on week days.
Initial download of the metrics may take a while.