Fig. 3
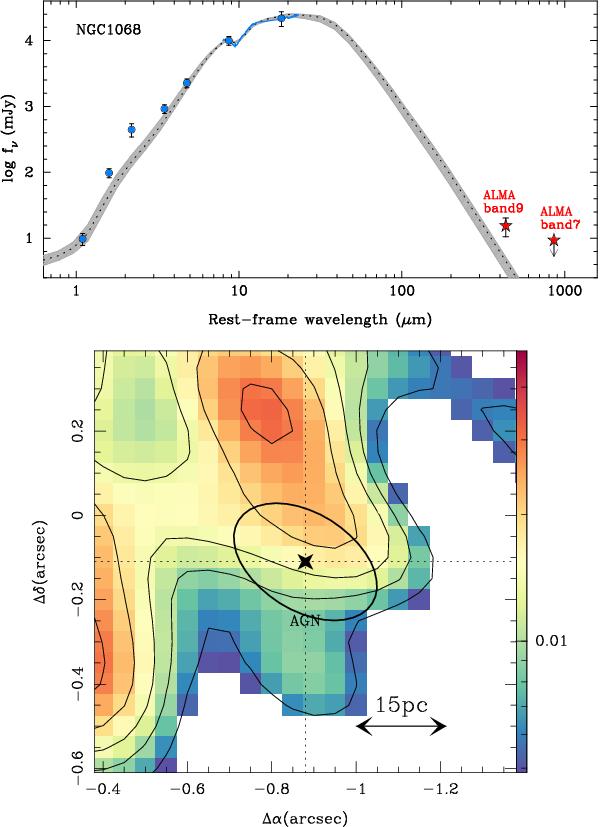
Upper panel: the nuclear SED of the dust continuum emission in NGC 1068 derived using NIR and MIR continuum and spectroscopy data (blue squares) from Alonso-Herrero et al. (2011), and the ALMA data points in Bands 7 and 9 (red stars). The SED was derived in apertures centered at the AGN that range from  (~14 pc) for NIR data to
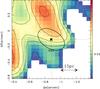
  (~35 pc) for MIR and Band-7 ALMA data. The best CLUMPY model fit to the observations (curve) and the 1σ uncertainty range of the fit (gray shaded region) are superposed onto the data points. Lower panel: a close-up view of the dust continuum emission in Band 9. Levels and markers are as in Fig. 1. The (
 )-aperture used to extract the flux at the position of the AGN is plotted as an ellipse.
Current usage metrics show cumulative count of Article Views (full-text article views including HTML views, PDF and ePub downloads, according to the available data) and Abstracts Views on Vision4Press platform.
Data correspond to usage on the plateform after 2015. The current usage metrics is available 48-96 hours after online publication and is updated daily on week days.
Initial download of the metrics may take a while.