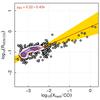
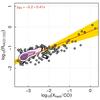
Fig. 20

a) (Left panel) The HCN(4–3)/CO(3–2) velocity-integrated intensity ratio (RHCN / CO, in logarithmic scale) versus the ratio of X-ray flux in the 6–8 keV band (in counts s-1) to the CO(3–2) intensities (in K km s-1) (Xhard/CO, in logarithmic scale) measured at a common spatial resolution of 0.5″ over the CND (open circles). Isodensity contours illustrate the distribution of values in this parameter space for 10%, 25%, and 50% of the data points. The straight line represents the bisector linear fit to the data in logarithmic scale [log(Xhard/CO), log(RHCN / CO)]. The yellow-shaded area shows the range allowed by the ordinary least squares fits of y as a function of x and viceversa. The parameters for the bisector fit are indicated. b) (Right panel) Same as a) but particularized for the HCO+(4–3)/CO(3–2) ratio (RHCO+/ CO) versus Xhard/CO. The linear correlation coefficients of the regressions are r ~ 0.7
Current usage metrics show cumulative count of Article Views (full-text article views including HTML views, PDF and ePub downloads, according to the available data) and Abstracts Views on Vision4Press platform.
Data correspond to usage on the plateform after 2015. The current usage metrics is available 48-96 hours after online publication and is updated daily on week days.
Initial download of the metrics may take a while.