Fig. 19
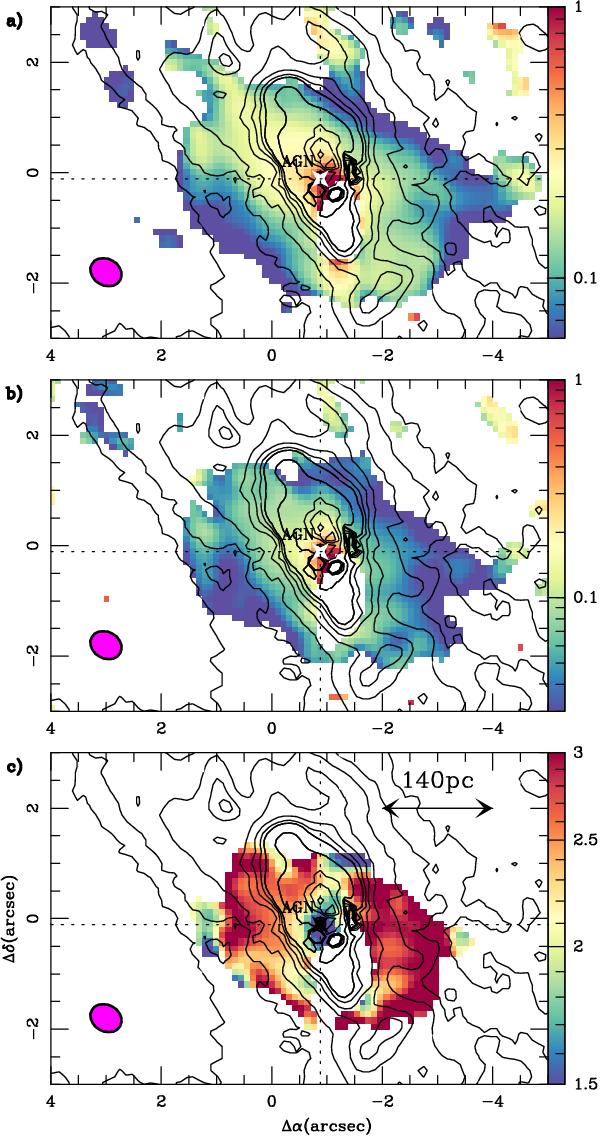
a) Overlay of the HST Paα emission map (in contours as in Fig. 15c) on the HCN(4–3)/CO(3–2) brightness temperature ratio map (in color scale and Tmb units). b) Same as a) but showing the HCO+(4–3)/CO(3–2) brightness temperature ratio map. c) Same as a) but showing the HCN(4–3)/HCO+(4–3) brightness temperature ratio map. All the ratio maps have been derived at the spatial resolution of the CO(3–2) observations ( at PA = 60°; ellipses in lower left corners).
Current usage metrics show cumulative count of Article Views (full-text article views including HTML views, PDF and ePub downloads, according to the available data) and Abstracts Views on Vision4Press platform.
Data correspond to usage on the plateform after 2015. The current usage metrics is available 48-96 hours after online publication and is updated daily on week days.
Initial download of the metrics may take a while.