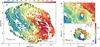
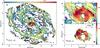
Fig. 10

a) Overlay of CO(3–2) isovelocity contours that span the range (–180 km s-1, 180 km s-1) in steps of 30 km s-1 on a false-color velocity map (linear color scale as shown). Velocities refer to vsys(HEL) = 1127 km s-1. b) Same as a) but zooming in on the CND region with a 20 km s-1 – velocity spacing. c) Same as b) but derived from the CO(6–5) data. d) Overlay of the CO(3–2) line widths (FWHM) shown in contours (10, 30, 50 to 200 km s-1 in steps of 30 km s-1) on a false-color width map (logarithmic color scale as shown). e) Same as d) but zooming in on the CND region. f) Same as e) but derived from the CO(6–5) data.
Current usage metrics show cumulative count of Article Views (full-text article views including HTML views, PDF and ePub downloads, according to the available data) and Abstracts Views on Vision4Press platform.
Data correspond to usage on the plateform after 2015. The current usage metrics is available 48-96 hours after online publication and is updated daily on week days.
Initial download of the metrics may take a while.