Fig. 1
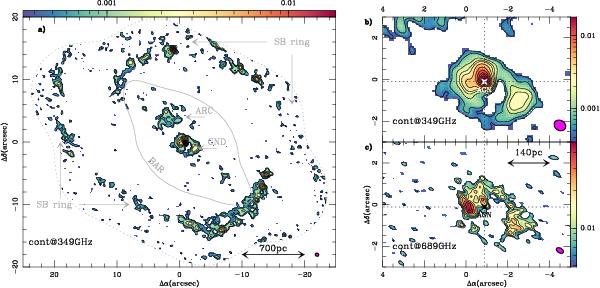
a) The continuum emission map of NGC 1068 obtained with ALMA at 349 GHz. The map is shown in color scale (in Jy beam-1 units as indicated) with contour levels 3σ, 5σ, 10σ, 15σ, 20σ, 30σ to 120σ in steps of 15σ, where 1σ = 0.14 mJy beam-1. (Δα, Δδ)-offsets are relative to the location of the phase tracking center adopted in this work: α2000 = 02h42m40.771s, δ2000 = − 00°00′47.84″. We highlight the location of the regions and components of the emission described in Sect. 3: the CND, the bar (identified by a representative isophote of the NIR K-band image of 2MASS), the bow-shock arc, and the SB ring. We also plot the edge of the eleven-field mosaic (gray dashed contour). The filled ellipse at the bottom right corner represents the beam size at 349 GHz ( at PA = 60°). b) Same as a) but zooming in on the CND region. The position of the AGN ([Δα, Δδ] ≈ [–0.9″, –0.1″] = [α2000 = 02h42m40.71s, δ2000 = − 00°00′47.94″]) is highlighted by the star marker. c) Continuum emission in the CND region at 689 GHz. Color scale is given in Jy beam-1 units. Contour levels are 3σ, 5σ, 7σ, and 10σ to 25σ in steps of 5σ, where 1σ = 1.95 mJy beam-1. The filled ellipse at the bottom right corner represents the beam size at 689 GHz (
 at PA = 50°).
Current usage metrics show cumulative count of Article Views (full-text article views including HTML views, PDF and ePub downloads, according to the available data) and Abstracts Views on Vision4Press platform.
Data correspond to usage on the plateform after 2015. The current usage metrics is available 48-96 hours after online publication and is updated daily on week days.
Initial download of the metrics may take a while.