Fig. 6
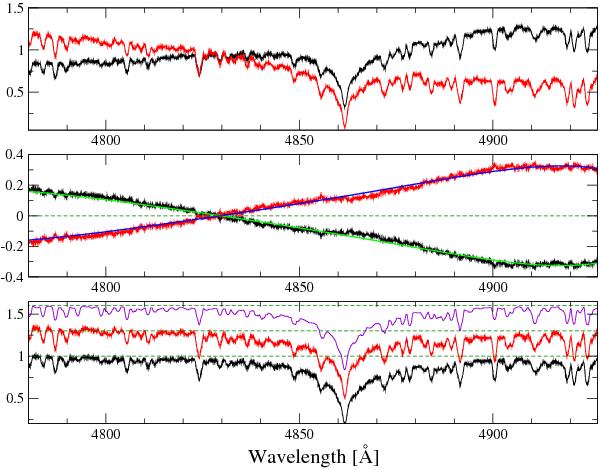
Disentangled spectra (top panel), bias (middle panel) and polynomial fits to the bias (smooth lines), and corrected spectra (bottom panel). The spectra shown in black and red correspond to component A and B, respectively. For the corrected spectra the fits to the bias were simply subtracted. The top spectrum of the bottom panel is a synthesis calculated with Teff = 6800 K, log g = 3.2 and solar metallicity (violet line). The dashed horizontal lines indicate the continuum. The individual spectra are shifted for better visibility. A colour version of this figure is available online.
Current usage metrics show cumulative count of Article Views (full-text article views including HTML views, PDF and ePub downloads, according to the available data) and Abstracts Views on Vision4Press platform.
Data correspond to usage on the plateform after 2015. The current usage metrics is available 48-96 hours after online publication and is updated daily on week days.
Initial download of the metrics may take a while.