Fig. 5
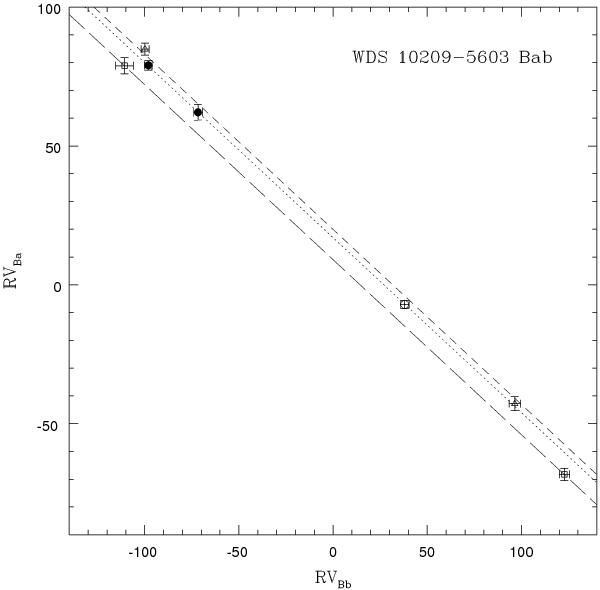
Linear correlation between the RVs of the components of WDS 10209–5603 Bab. Open squares represent measurements made in February 2013. These are fitted by the function RVBa = −0.63RVBb + 9.1 km s-1, which is shown with a long-dashed line. Open triangles represent measurements made in February and April 2008, and filled circles indicate measurements of March and May 2009. Adopting a mass ratio q = 0.63, these data are fitted by the function RVBa = −0.63RVBb + 20.0 km s-1 (short-dashed line), and the function RVBa = −0.63RVBb + 17.0 km s-1 (dotted line), respectively. Open circle indicates RVs measured in a spectrum acquired in April 2010.
Current usage metrics show cumulative count of Article Views (full-text article views including HTML views, PDF and ePub downloads, according to the available data) and Abstracts Views on Vision4Press platform.
Data correspond to usage on the plateform after 2015. The current usage metrics is available 48-96 hours after online publication and is updated daily on week days.
Initial download of the metrics may take a while.