Fig. 8
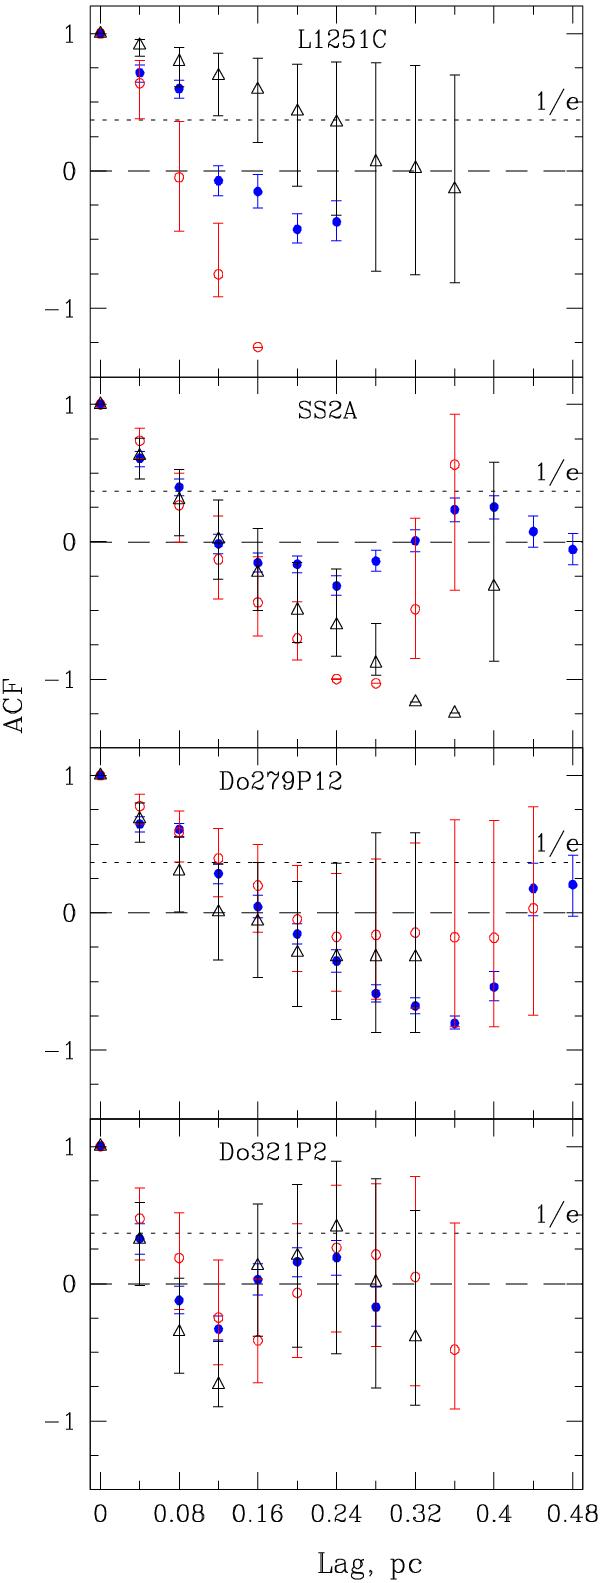
Testing the isotropy of the observed velocity field. Blue dots show azimuthally averaged autocorrelation functions (ACFs), as already plotted in Fig. 7, whereas ACFs calculated for directions N → S and E → W are shown by red open circles and black open triangles, respectively. Error bars show 1σ statistical errors. At large lags due to poor statistics, some points without error bars have a formal value | ACF | ≥ 1, and therefore, their errors cannot be defined using Eq. (9). In panel L1251C, a large-scale gradient of the velocity field (see Fig. 6b) manifests itself as a monotonically decreasing ACF with increasing lags in the direction of the velocity gradient and as positive correlations for perpendicular direction. Both N-S and E-W ACFs deviate significantly from the azimuthally averaged ACF. On the other hand, panels SS2A, Do279P12, and Do321P2 show similar damping oscillations for all three ACFs, as expected, if the velocity field is homogeneous and isotropic.
Current usage metrics show cumulative count of Article Views (full-text article views including HTML views, PDF and ePub downloads, according to the available data) and Abstracts Views on Vision4Press platform.
Data correspond to usage on the plateform after 2015. The current usage metrics is available 48-96 hours after online publication and is updated daily on week days.
Initial download of the metrics may take a while.