Fig. 7
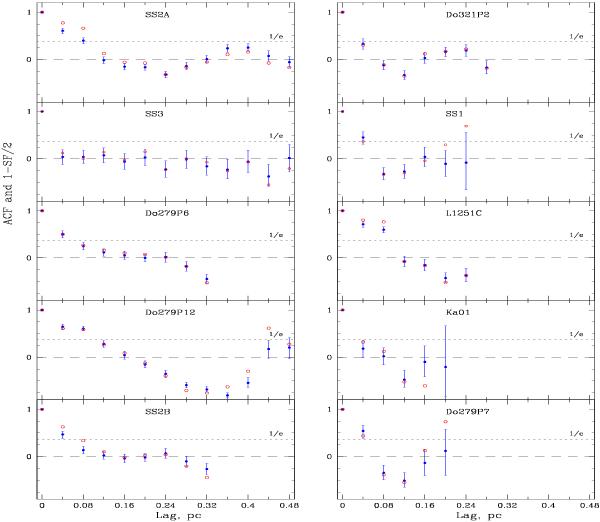
Azimuthally averaged autocorrelation functions (ACFs) plotted by blue dots with 1σ error bars and azimuthally averaged structure functions (SFs) plotted by red open circles for the NH3 turbulent velocity fields. For the SFs, the values (1 – SF/2) are shown to check homogeneity of the velocity map in accord with Eq. (7). The error bars for the (1 – SF/2) points are the same as for the ACFs. The zero and 1/e levels are shown by long- and short-dashed lines. The sources Do279P6, Do279P7, Do279P12, Do321P2, Ka01, and SS3 are from Paper I, while SS1, SS2A, SS2B, and L1251C are from the present paper.
Current usage metrics show cumulative count of Article Views (full-text article views including HTML views, PDF and ePub downloads, according to the available data) and Abstracts Views on Vision4Press platform.
Data correspond to usage on the plateform after 2015. The current usage metrics is available 48-96 hours after online publication and is updated daily on week days.
Initial download of the metrics may take a while.