Fig. 4
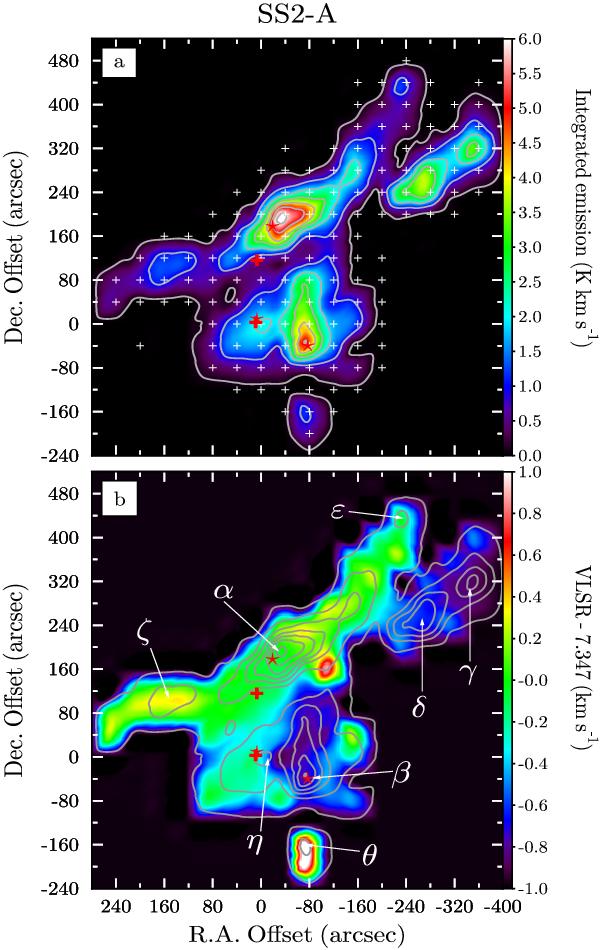
A zoomed portion of the map shown in Fig. 3. a) NH3(1, 1) intensity map of SS2A. The starting point for the contour levels is 0.1 K km s-1; the increment is 0.9 K km s-1 between the first two and 1.0 K km s-1 between the other contour levels. White crosses mark measured positions, red crosses indicate the location of the IR sources IRAS 18264–0143 and IRAS 18264–0142 (Beichman et al. 1988), and red stars determine Class 0 protostars (Maury et al. 2011). b) NH3(1, 1) radial velocity field (color map) shown after subtracting the mean radial velocity ⟨VLSR⟩ = 7.347 km s-1. The ammonia intensity peaks are labeled as in Table 1. The origin of the map position is as in Fig. 3.
Current usage metrics show cumulative count of Article Views (full-text article views including HTML views, PDF and ePub downloads, according to the available data) and Abstracts Views on Vision4Press platform.
Data correspond to usage on the plateform after 2015. The current usage metrics is available 48-96 hours after online publication and is updated daily on week days.
Initial download of the metrics may take a while.