Fig. 2
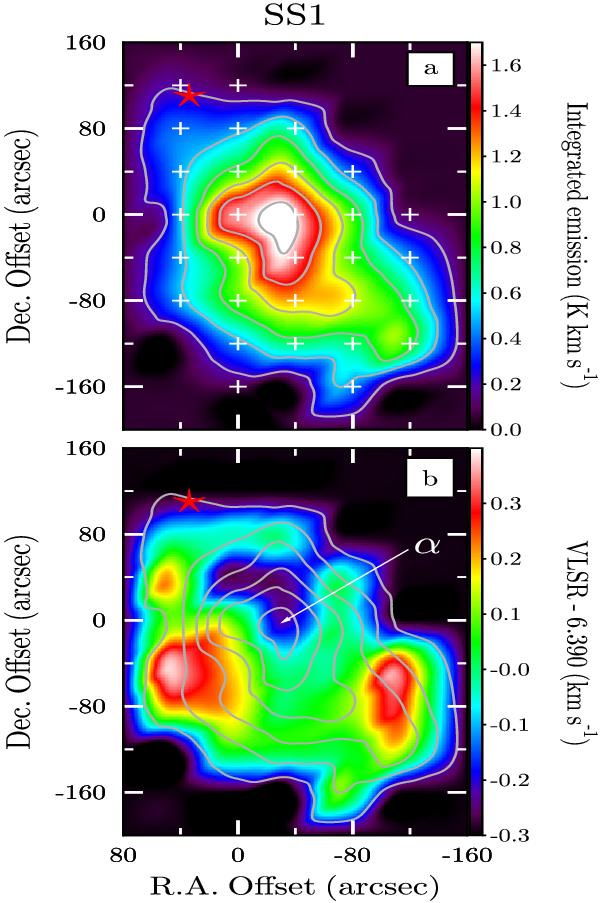
a) NH3(1, 1) intensity map (∫TMBdv) of the molecular core SS1. The starting point for the contour levels is 0.2 K km s-1; the increment is 0.3 K km s-1. Crosses mark measured positions; the red star indicates the location of the IR source IRAS 18265–0205 (Beichman et al. 1988). b) NH3(1, 1) radial velocity field (color map) shown after subtracting the mean radial velocity ⟨VLSR⟩ = 6.390 km s-1. The NH3 peak is labeled as in Table 1. The (0, 0) map position is RA = 18:29:09.6, Dec = − 02:05:40 (J2000).
Current usage metrics show cumulative count of Article Views (full-text article views including HTML views, PDF and ePub downloads, according to the available data) and Abstracts Views on Vision4Press platform.
Data correspond to usage on the plateform after 2015. The current usage metrics is available 48-96 hours after online publication and is updated daily on week days.
Initial download of the metrics may take a while.