Fig. 7
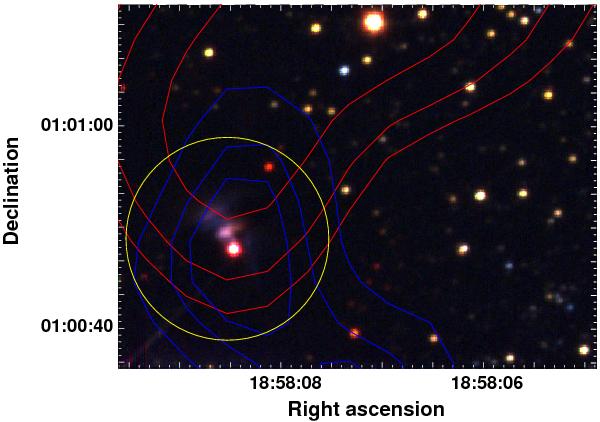
UKIDSS three-colour image (JHK-bands in blue, green and red) of the MSXG34 region. The red- and blue-shifted lobes of the molecular outflows are included. The yellow circle, 30′′ in size, corresponds to the 500 μm continuum emission from SPIRE (above 5σ of the rms noise level) as extracted from the Herschel Science Archive.
Current usage metrics show cumulative count of Article Views (full-text article views including HTML views, PDF and ePub downloads, according to the available data) and Abstracts Views on Vision4Press platform.
Data correspond to usage on the plateform after 2015. The current usage metrics is available 48-96 hours after online publication and is updated daily on week days.
Initial download of the metrics may take a while.