Fig. 9
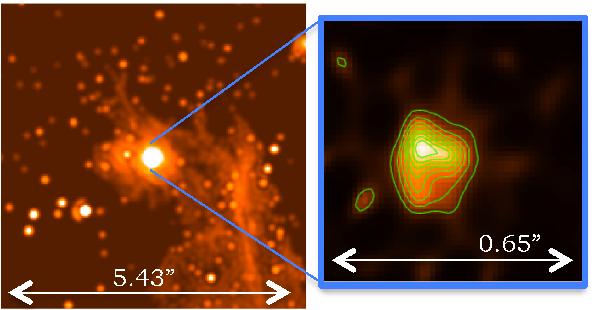
Left: L′-band image of the surroundings of IRS 10W. The filamentary structure of the NA is appreciated as well as some additional close-by stars with extended emission. Right: the reconstructed SAM image of IRS 10W in L′ band. An asymmetric structure can be seen. Contours represents 10, 20, 30, 40, 50, 60, 70, 80, and 90 % of the peak flux.
Current usage metrics show cumulative count of Article Views (full-text article views including HTML views, PDF and ePub downloads, according to the available data) and Abstracts Views on Vision4Press platform.
Data correspond to usage on the plateform after 2015. The current usage metrics is available 48-96 hours after online publication and is updated daily on week days.
Initial download of the metrics may take a while.