Fig. 8
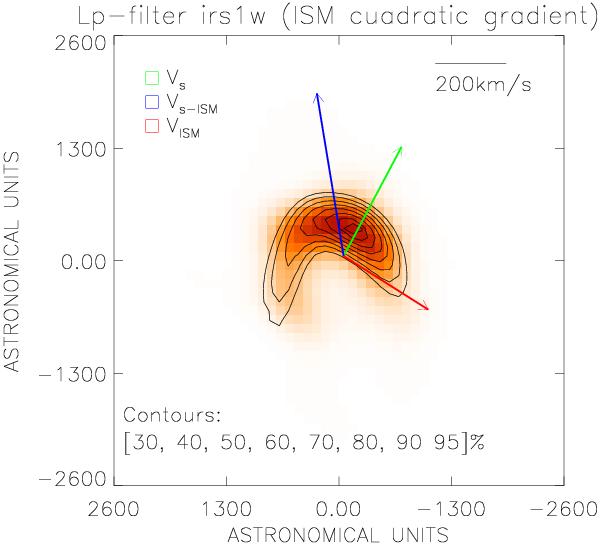
Model of a bow shock in an ISM with a quadratic density gradient. The L′ image of IRS 1W is represented in color and the best-fit gradient model is overplotted as contours. The colored vectors represent the velocity of the star (Vs; green arrow), the relative motion of the star through the ISM (Vs−ISM; blue arrow) and the dust motion of the ISM obtained with our bow-shock model (VISM; red arrow).
Current usage metrics show cumulative count of Article Views (full-text article views including HTML views, PDF and ePub downloads, according to the available data) and Abstracts Views on Vision4Press platform.
Data correspond to usage on the plateform after 2015. The current usage metrics is available 48-96 hours after online publication and is updated daily on week days.
Initial download of the metrics may take a while.