Fig. 4
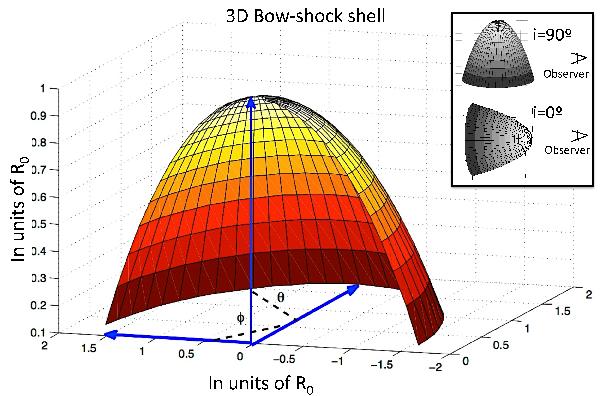
3D Diagram of the bow-shock shell created by our model. The diagram is sliced and the interior of the bow shock is visible. The two polar angles φ and θ are shown (see Eqs. (2) and (3)). The blue axis is centered on the position of the star and the scale is in multiples of R0. The inset in the upper-right part of the diagram shows the change in bow shock inclination angle as seen from the observer.
Current usage metrics show cumulative count of Article Views (full-text article views including HTML views, PDF and ePub downloads, according to the available data) and Abstracts Views on Vision4Press platform.
Data correspond to usage on the plateform after 2015. The current usage metrics is available 48-96 hours after online publication and is updated daily on week days.
Initial download of the metrics may take a while.