Fig. 9
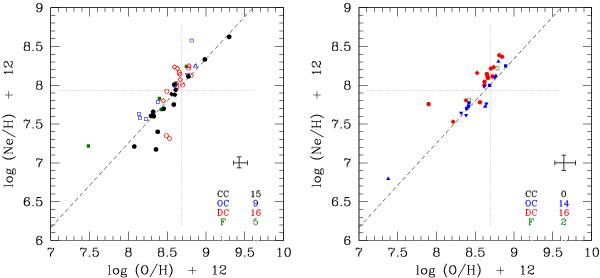
Diagrams of nebular abundance ratio Ne/H vs. O/H for Galactic disc PNe (left panel) and Galactic bulge PNe (right panel). The same meaning of symbols as in Figs. 5 and 6. The horizontal/vertical lines mark the solar abundance values, while the dashed line marks the relation derived by Izotov et al. (2006).
Current usage metrics show cumulative count of Article Views (full-text article views including HTML views, PDF and ePub downloads, according to the available data) and Abstracts Views on Vision4Press platform.
Data correspond to usage on the plateform after 2015. The current usage metrics is available 48-96 hours after online publication and is updated daily on week days.
Initial download of the metrics may take a while.