Free Access
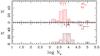
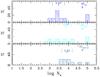
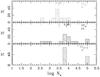
Fig. 13
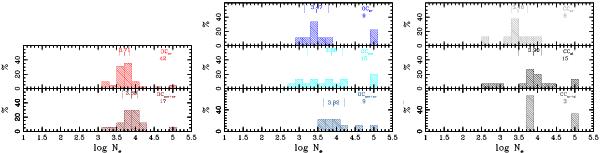
Histograms of nebular electron density Ne derived from [S ii] λ6731/6717 ratio for combined samples of Galactic disc and bulge PNe. The left to right panels present distributions for dust subtypes of DC, OC, and CC PNe, respectively.
This figure is made of several images, please see below:
Current usage metrics show cumulative count of Article Views (full-text article views including HTML views, PDF and ePub downloads, according to the available data) and Abstracts Views on Vision4Press platform.
Data correspond to usage on the plateform after 2015. The current usage metrics is available 48-96 hours after online publication and is updated daily on week days.
Initial download of the metrics may take a while.