Fig. 3
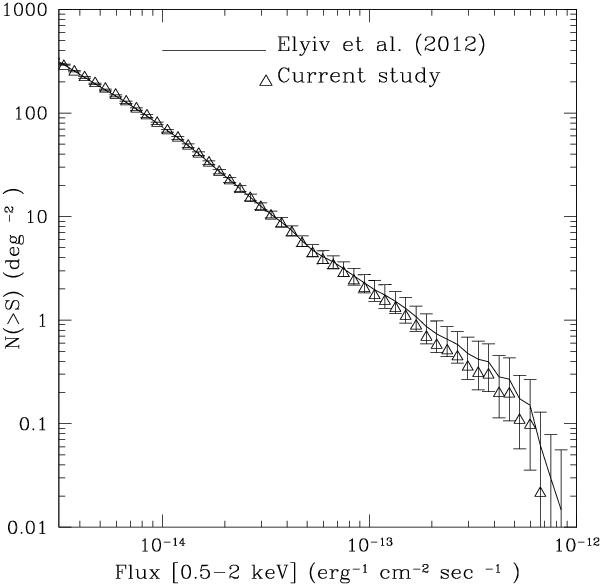
log N − log S distribution in the soft band for the whole XMM-LSS sample (line). The triangles denote the test values derived from random sources in the area of 10 galaxy clusters in the current study. Errorbars denote the 1σ Poissonian uncertainty of the Elyiv et al. (2012) points.
Current usage metrics show cumulative count of Article Views (full-text article views including HTML views, PDF and ePub downloads, according to the available data) and Abstracts Views on Vision4Press platform.
Data correspond to usage on the plateform after 2015. The current usage metrics is available 48-96 hours after online publication and is updated daily on week days.
Initial download of the metrics may take a while.