Free Access
Fig. 4
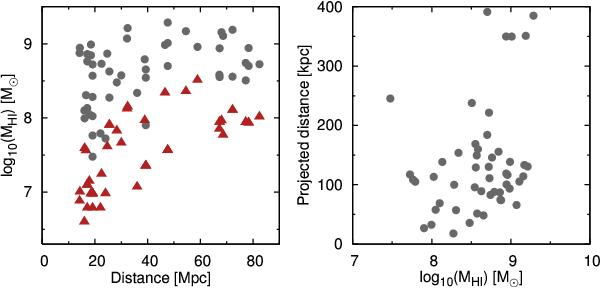
Left panel, grey dots: Hi masses of detected companions as a function of distance; red triangles: lowest detectable mass in the corresponding data-cubes. Right panel: distance from the main galaxies projected onto the plane of the sky of the detected satellites as a function of their Hi mass.
Current usage metrics show cumulative count of Article Views (full-text article views including HTML views, PDF and ePub downloads, according to the available data) and Abstracts Views on Vision4Press platform.
Data correspond to usage on the plateform after 2015. The current usage metrics is available 48-96 hours after online publication and is updated daily on week days.
Initial download of the metrics may take a while.