Fig. 9
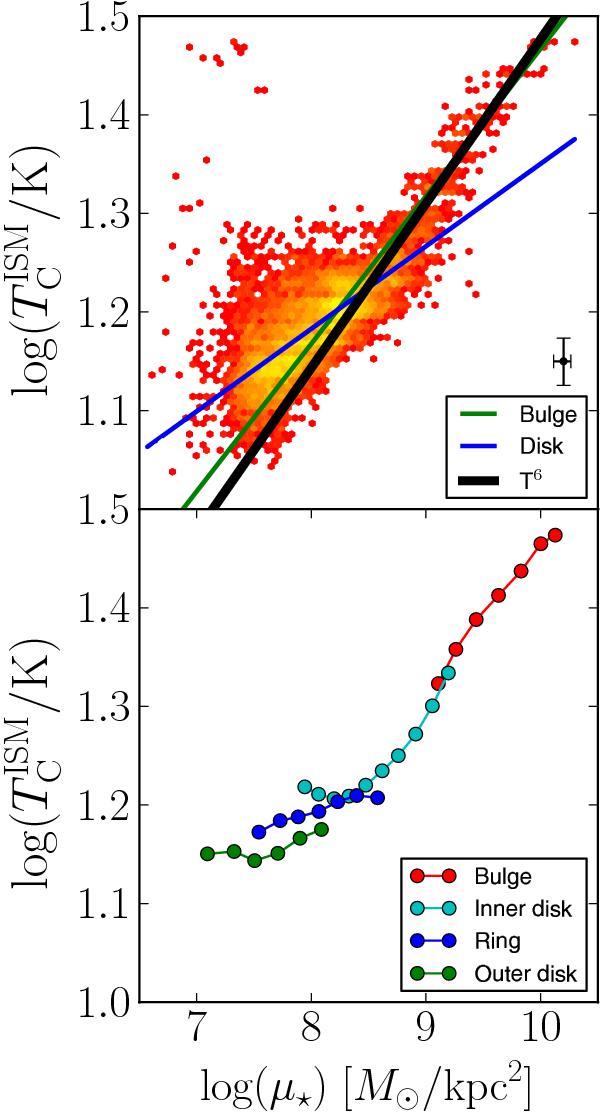
Top: density plot of the stellar mass surface density μ⋆ vs.  for the individual sub-kpc regions of M 31. Yellow points indicate a higher density of points, red a lower density. A linear function was fit to the bulge (green line) and disk (blue line) regions. The black line is a theoretical function for pure heating by the old stellar populations. Bottom: same relation, but separated in the macro-regions for M 31: the bulge (red), the inner disk (cyan), the 10 kpc ring (blue), and the outer disk (green). All pixel values are binned in μ⋆; each point is the average of a bin.
Current usage metrics show cumulative count of Article Views (full-text article views including HTML views, PDF and ePub downloads, according to the available data) and Abstracts Views on Vision4Press platform.
Data correspond to usage on the plateform after 2015. The current usage metrics is available 48-96 hours after online publication and is updated daily on week days.
Initial download of the metrics may take a while.