Free Access
Fig. 8
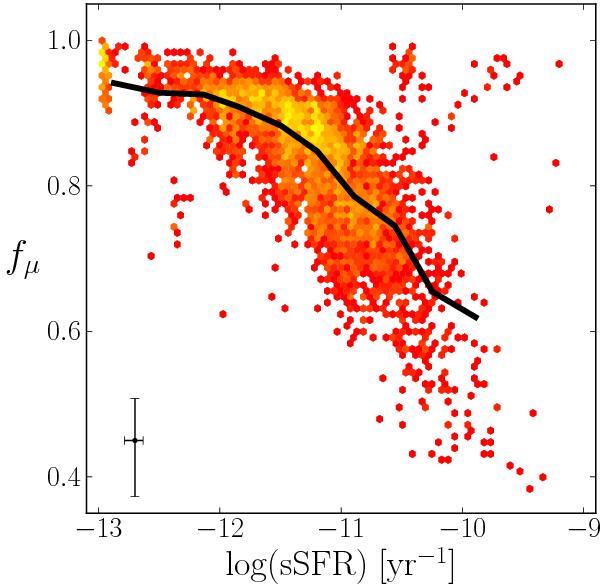
Density plot of the sSFR against fμ, the luminosity fraction of ISM dust to the total dust. Yellow points indicate a higher density of points, red a lower density. The black line represents the mean trend of the points.
Current usage metrics show cumulative count of Article Views (full-text article views including HTML views, PDF and ePub downloads, according to the available data) and Abstracts Views on Vision4Press platform.
Data correspond to usage on the plateform after 2015. The current usage metrics is available 48-96 hours after online publication and is updated daily on week days.
Initial download of the metrics may take a while.