Fig. 6
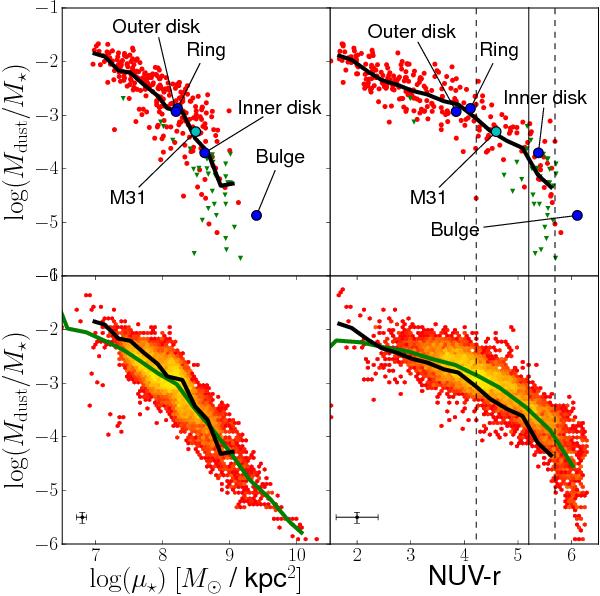
Top: dust scaling relations from the Herschel Reference Survey (Cortese et al. 2012); the specific dust mass Mdust/M⋆ as a function of the stellar mass surface density μ⋆ (left) and NUV-r colour (right). NUV-r serves as an inverse tracer of the sSFR. Red are Herschel detected galaxies, green are upper limits for the undetected ones. The blue dots represent the macro-regions of M 31 and the cyan dot indicates the position of the galaxy itself. The thick black line is the HRS mean trend. The vertical solid line indicates our division between late-type and early-type galaxies. The dashed vertical lines indicate the bluest early-type galaxy and the reddest late-type galaxy, respectively. Bottom: same scaling relations, but now represented in a density plot using single pixel regions from M 31. Yellow points indicate a higher density of points, red a lower density. The black line is the HRS mean trend, the green line is the M 31 mean trend.
Current usage metrics show cumulative count of Article Views (full-text article views including HTML views, PDF and ePub downloads, according to the available data) and Abstracts Views on Vision4Press platform.
Data correspond to usage on the plateform after 2015. The current usage metrics is available 48-96 hours after online publication and is updated daily on week days.
Initial download of the metrics may take a while.