Fig. 2
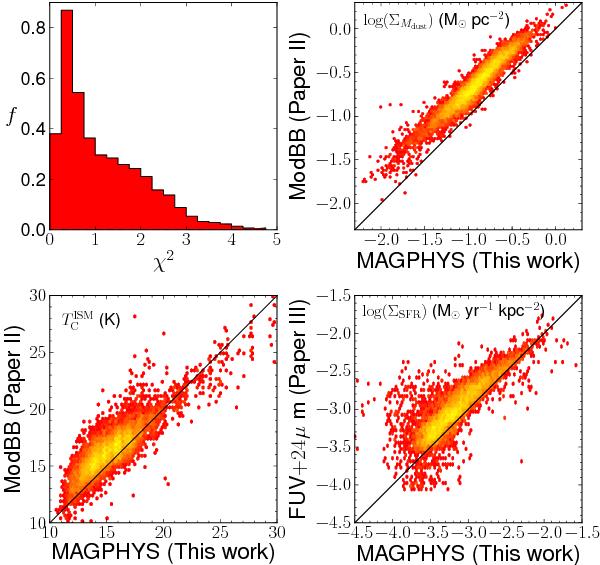
Upper-left: χ2 distribution of the fits. Other panels: density plots comparing dust mass surface density, cold dust temperature, and star formation rate derived from MAGPHYS single pixel fits against modified black-body fits to Herschel bands (Paper II) and FUV+ 24 μm SFR tracers (Paper III). Red indicates a small number of data points, yellow a large number. The black line represents the 1:1 relation.
Current usage metrics show cumulative count of Article Views (full-text article views including HTML views, PDF and ePub downloads, according to the available data) and Abstracts Views on Vision4Press platform.
Data correspond to usage on the plateform after 2015. The current usage metrics is available 48-96 hours after online publication and is updated daily on week days.
Initial download of the metrics may take a while.