Free Access
Fig. 1
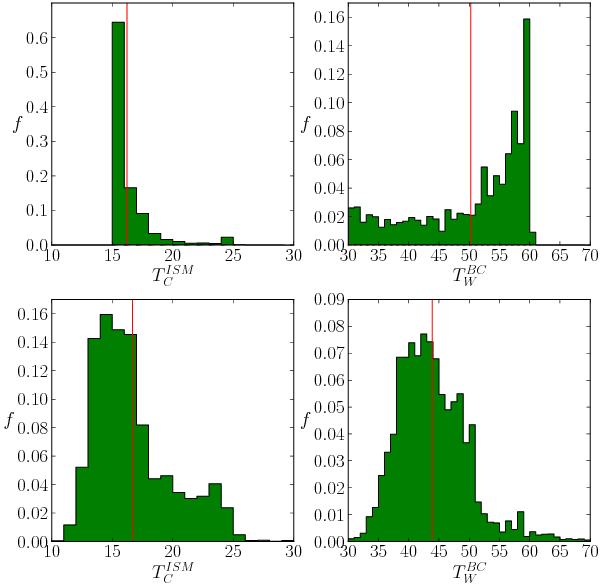
Distribution of the dust temperatures for the individual pixel fits. Top row: results from the standard MAGPHYS version. Bottom row: results from the modified version, using broader temperature ranges for the priors. The red lines indicate the average sample values.
Current usage metrics show cumulative count of Article Views (full-text article views including HTML views, PDF and ePub downloads, according to the available data) and Abstracts Views on Vision4Press platform.
Data correspond to usage on the plateform after 2015. The current usage metrics is available 48-96 hours after online publication and is updated daily on week days.
Initial download of the metrics may take a while.