Free Access
Fig. 2
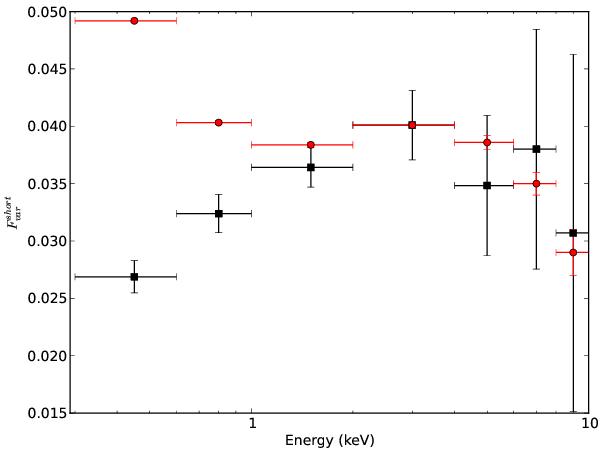
Fractional variability as a function of energy. The black squares represent the variability spectrum on short time scale,  (1 ks ≲ T ≲ 60 ks); the red circles are the corresponding variability values predicted from the long time scale variability spectrum,
  (60 ks ≲ T ≲ 1 month).
Current usage metrics show cumulative count of Article Views (full-text article views including HTML views, PDF and ePub downloads, according to the available data) and Abstracts Views on Vision4Press platform.
Data correspond to usage on the plateform after 2015. The current usage metrics is available 48-96 hours after online publication and is updated daily on week days.
Initial download of the metrics may take a while.