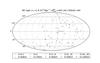
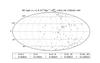
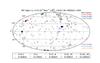
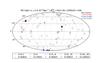
Fig. 26
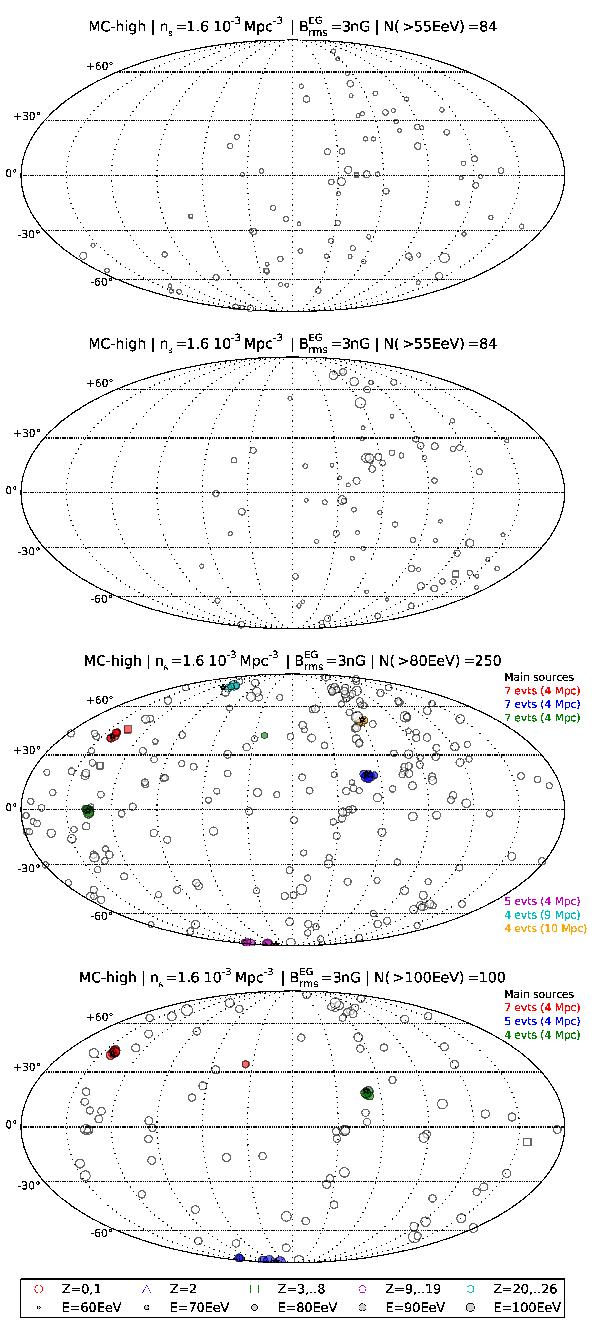
Examples of typical sky maps corresponding to the proton-dominated MC-high model with extremely high source density, ns = 1.6 10-3 Mpc-3. The first (top) panel shows one of the realizations that gave the weakest signal of anisotropy (out of the 500 realizations simulated) with the current Pierre Auger Observatory statistics. The second panel shows the realization lying in the middle of the distribution (see text). The third and fourth panels show the expected sky maps with the reference statistics of JEM-EUSO with thresholds at 80 EeV and 100 EeV, respectively, for the same realization as in the second panel (Pierre Auger Observatory energy scale).
Current usage metrics show cumulative count of Article Views (full-text article views including HTML views, PDF and ePub downloads, according to the available data) and Abstracts Views on Vision4Press platform.
Data correspond to usage on the plateform after 2015. The current usage metrics is available 48-96 hours after online publication and is updated daily on week days.
Initial download of the metrics may take a while.