Fig. 23
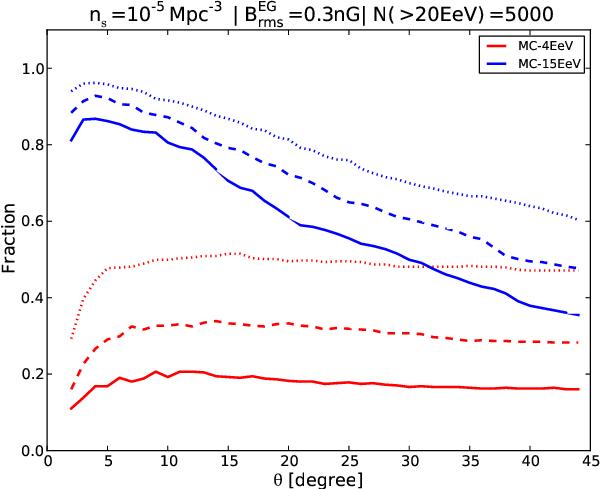
Fraction of the 500 realizations of the MC-4 EeV (red) and MC-15 EeV (blue) scenarios, with ns = 10-5 Mpc-3, which give an anisotropic signal with a significance over 2σ (dotted lines), 3σ (dashed lines), or 4σ (plain line), for statistics of 5000 events above 20 EeV with the coverage map of the Pierre Auger Observatory (see text).
Current usage metrics show cumulative count of Article Views (full-text article views including HTML views, PDF and ePub downloads, according to the available data) and Abstracts Views on Vision4Press platform.
Data correspond to usage on the plateform after 2015. The current usage metrics is available 48-96 hours after online publication and is updated daily on week days.
Initial download of the metrics may take a while.