Fig. 2
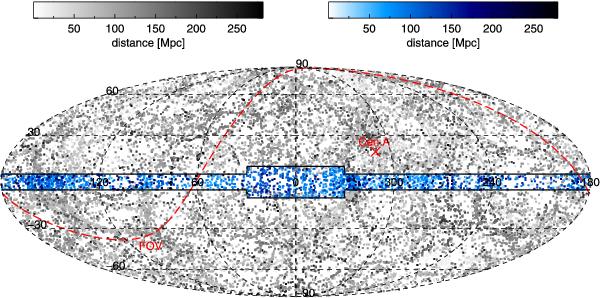
Galaxies in the 2MRS catalog displayed in Mollweide projection and Galactic coordinates. The black dots are galaxies in the original sample and the blue dots the randomly generated galaxies in the Galactic plane. The solid line indicates the region that was populated. The dashed red line indicates the border of the field of view of the Pierre Auger Observatory. A red cross marks the direction of the Centaurus A radio galaxy.
Current usage metrics show cumulative count of Article Views (full-text article views including HTML views, PDF and ePub downloads, according to the available data) and Abstracts Views on Vision4Press platform.
Data correspond to usage on the plateform after 2015. The current usage metrics is available 48-96 hours after online publication and is updated daily on week days.
Initial download of the metrics may take a while.